Cloud-native applications generate exponential log volumes, making effective log management critical for maintaining system reliability and troubleshooting performance issues. Open source log management tools provide cost-effective alternatives to expensive commercial solutions while offering the flexibility to customize approaches based on your infrastructure requirements.
However, selecting the right tool presents significant challenges. Teams often struggle with resource-intensive setups, complex scaling requirements, and balancing cost against functionality. Many organizations find themselves overwhelmed by operational overhead while trying to extract meaningful insights from their log data.
This guide examines 10 leading open source log management tools, analyzing their architecture, performance characteristics, and real-world deployment considerations to help you select the optimal solution for your needs.
Understanding Log Management Architecture
Before diving into specific tools, it's essential to understand the distinction between log aggregation and log analysis. Log aggregation involves collecting logs from distributed sources into centralized storage. Log analysis enables querying, visualization, and correlation to identify patterns and troubleshoot issues.
This architectural distinction impacts tool selection and deployment strategies:
| Tool | Log Aggregation | Log Analysis | Primary Strength |
|---|---|---|---|
| SigNoz | ✅ | ✅ | Unified observability with OpenTelemetry |
| Grafana Loki | ✅ | ✅ | Cost-efficient cloud-native storage |
| Graylog | ✅ | ✅ | Complete platform with SIEM capabilities |
| FluentD/Bit | ✅ | ❌ | Universal data routing and processing |
| Vector | ✅ | ❌ | High-performance Rust-based collection |
| Logstash | ✅ | ⚠️ Limited | Rich processing with Elastic ecosystem |
| OpenSearch | ❌ | ✅ | Full-text search and analytics |
| Syslog-ng | ✅ | ❌ | Enterprise-grade log forwarding |
| rsyslog | ✅ | ❌ | High-performance system logging |
| Logwatch | ⚠️ Basic | ✅ | Simple automated reporting |
Modern deployments often combine multiple tools—lightweight collectors paired with powerful analytics engines. Understanding these architectural patterns prevents costly mistakes and ensures scalable solutions.
1. SigNoz - OpenTelemetry-Native Unified Observability
SigNoz represents the next generation of observability platforms, combining logs, metrics, and traces in a single OpenTelemetry-native solution. Built on ClickHouse columnar database technology, SigNoz addresses the complexity and cost challenges of traditional log management approaches.
Unified Observability Platform: Unlike tools that handle only logs, SigNoz correlates logs with distributed traces and metrics, enabling comprehensive application monitoring. You can trace requests across microservices while simultaneously analyzing related log events and performance metrics.
OpenTelemetry Integration: As an OpenTelemetry-native platform, SigNoz benefits from standardized data collection protocols and growing ecosystem support. The OpenTelemetry Collector handles ingestion from virtually any source, while existing log forwarders like Fluentd or Logstash can send data directly to SigNoz.
High-Performance Architecture: SigNoz leverages ClickHouse columnar database technology for efficient storage and fast queries. This architecture delivers 2.5x faster ingestion and 13x faster aggregation compared to traditional ELK stack setups, even with high-cardinality data.
Simplified Operations: One-command deployment using Docker Compose or Helm charts eliminates the complexity of managing multiple components. Unlike ELK stack deployments requiring separate configuration of Elasticsearch, Logstash, and Kibana, SigNoz provides integrated setup and maintenance.
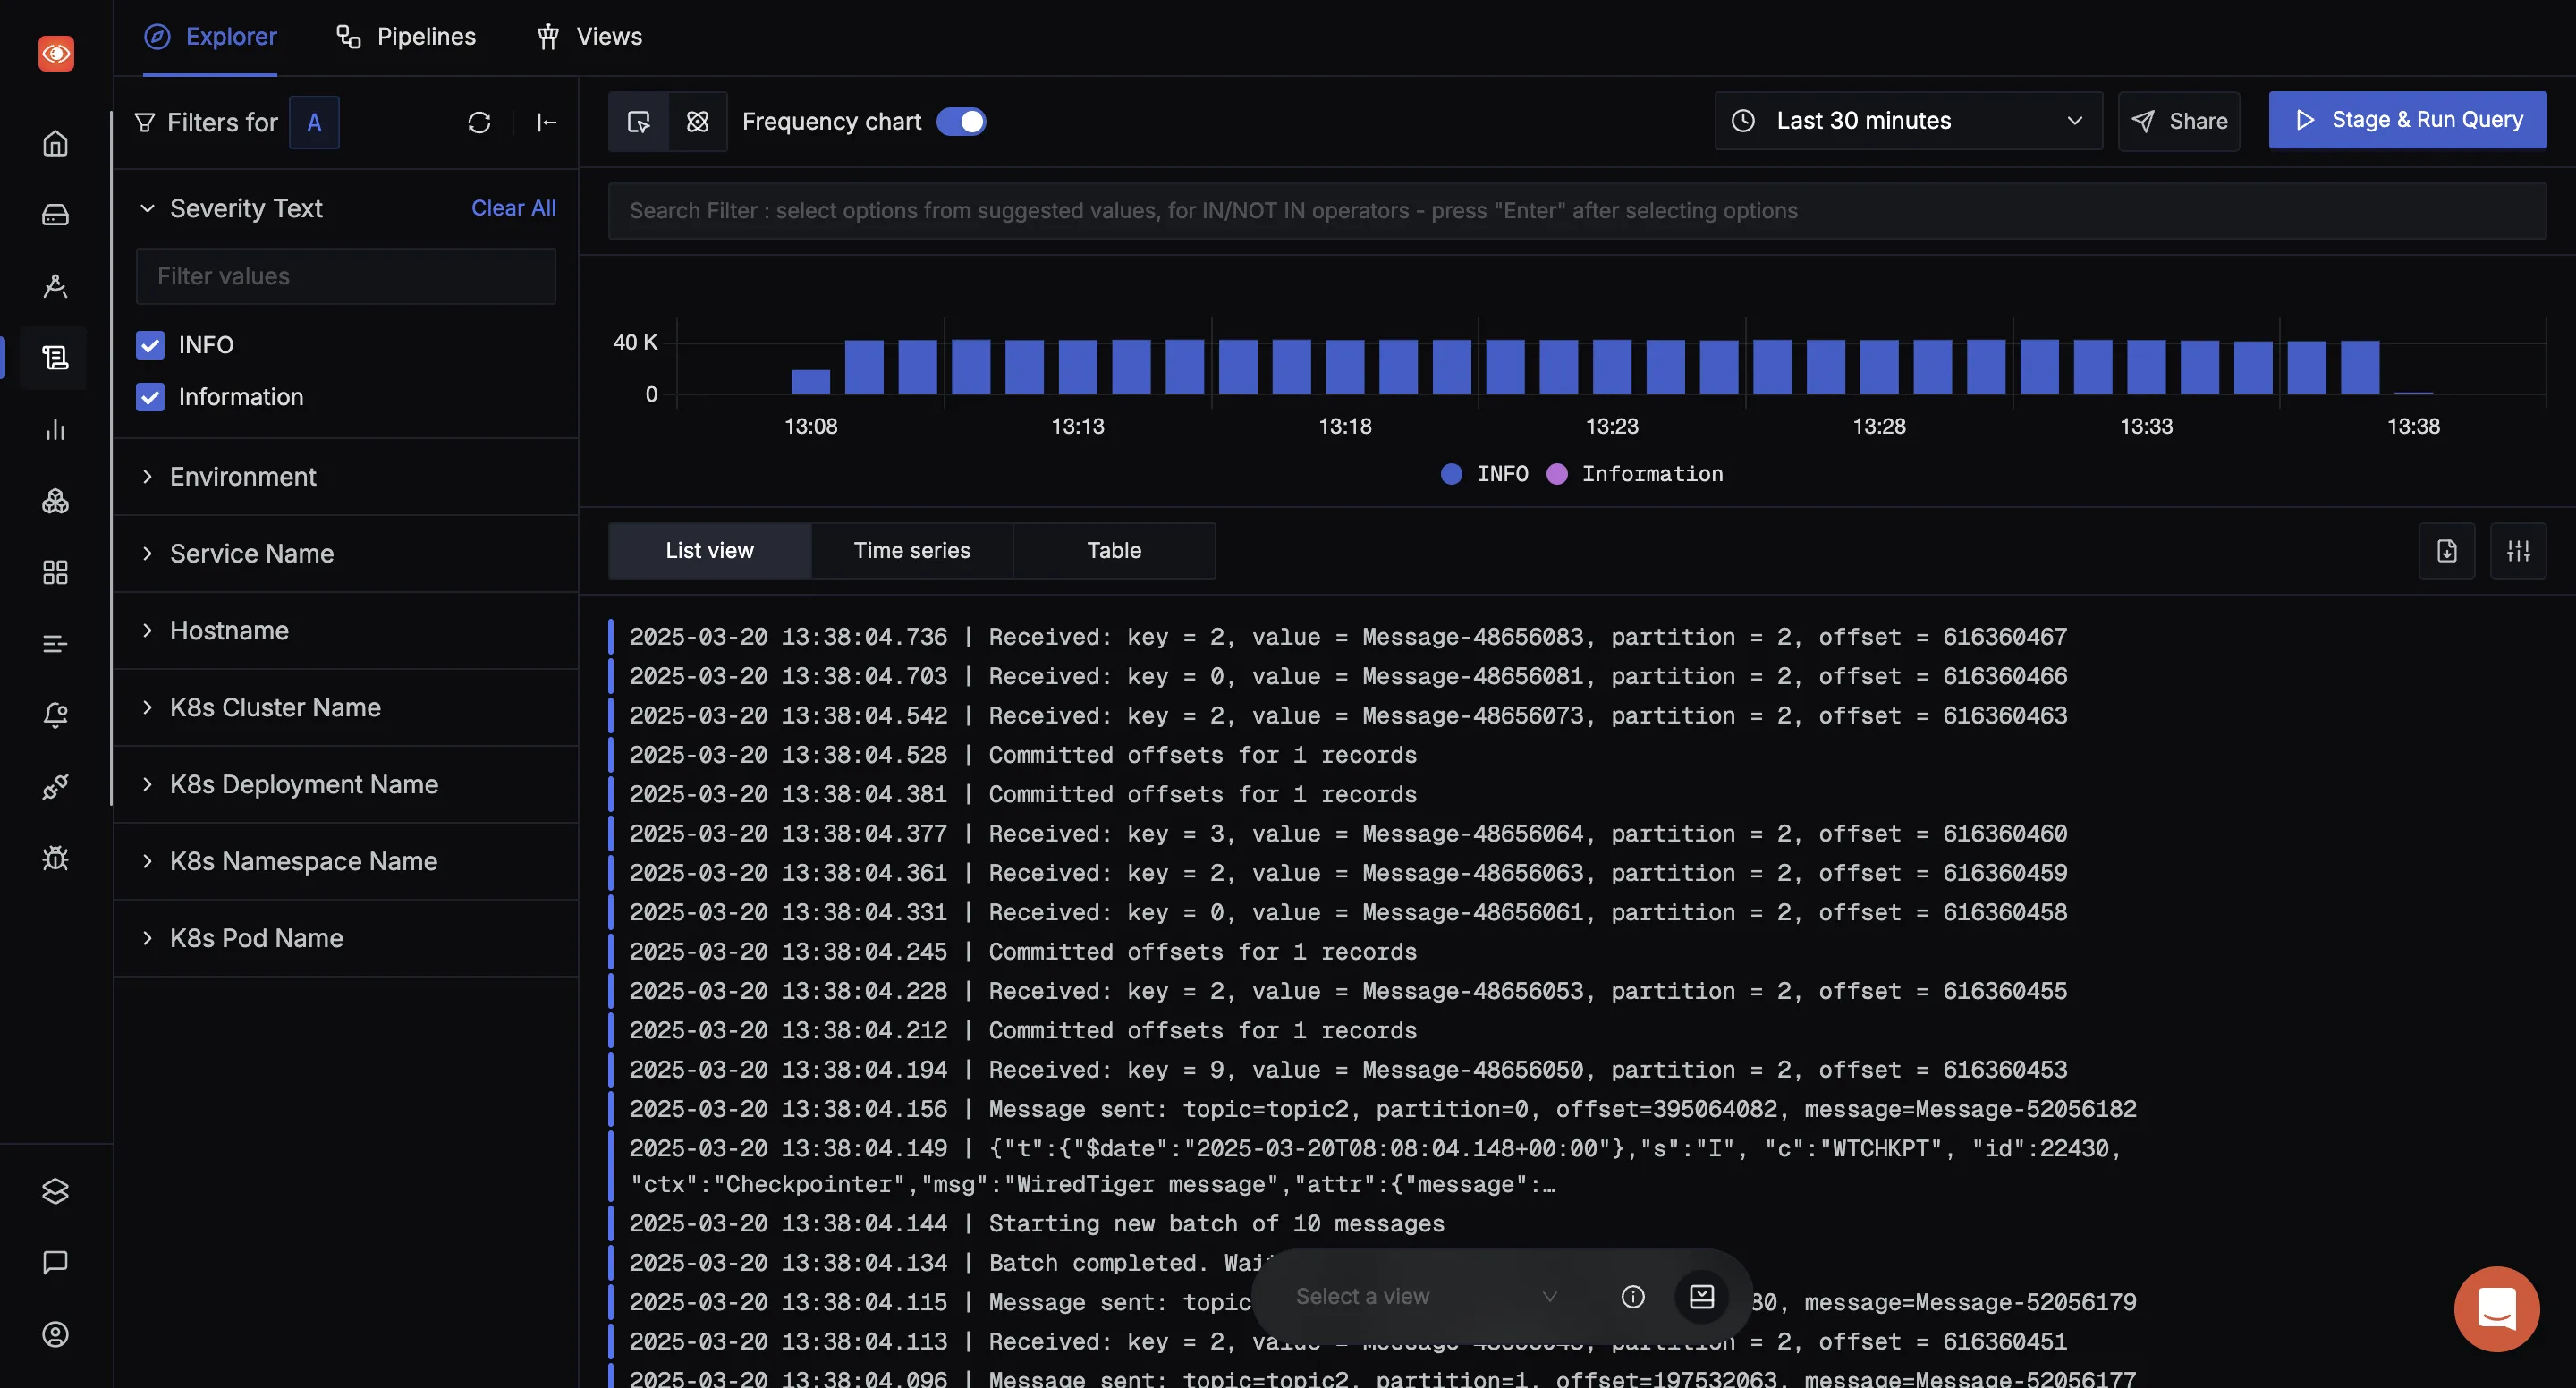
Advanced Log Analysis Features:
- Logs Explorer with Multiple Views: List view (raw, formatted, columnar), time series visualization, and tabular aggregation results
- No-Code Query Builder: Intuitive interface for constructing complex log queries with dropdown filters and multiple aggregation options
- Saved Views and Custom Dashboards: Monitor error logs from different services in one place with personalized monitoring environments
- Robust Alerting: Create alerts directly from log data patterns, metrics thresholds, or trace anomalies
- Context-Aware Search: "Show in Context" feature displays surrounding logs for faster debugging and troubleshooting
Long-Term Storage Options: SigNoz supports cost-effective log retention by forwarding logs to your cloud storage (S3, Google Cloud) while maintaining efficient querying capabilities through ClickHouse's native format.
Production Deployments: Organizations including Samsung and major enterprises rely on SigNoz for processing high-volume production workloads while maintaining responsive query performance.
Considerations: As a newer platform, SigNoz has a smaller plugin ecosystem compared to mature solutions like Logstash. However, OpenTelemetry compatibility provides extensive integration options, and the active development community continuously adds new features.
2. Grafana Loki - Cost-Efficient Cloud-Native Logging
Grafana Loki revolutionizes log storage through its label-only indexing approach, dramatically reducing storage costs and operational complexity compared to traditional full-text indexing solutions.
Architectural Innovation: Loki indexes only metadata labels (service names, pod identifiers, namespaces) while storing log content in compressed chunks on object storage like S3 or GCS. This approach reduces index sizes by 25x compared to Elasticsearch while enabling horizontal scaling through cloud storage.
Exceptional Cost Efficiency: By avoiding full-text indexing, Loki achieves 60-80% lower storage costs than Elasticsearch-based solutions. Organizations processing terabytes of logs monthly report dramatic cost reductions, particularly for long-term retention requirements.
Cloud-Native Architecture: Loki's microservices design includes distributors (ingestion), ingesters (writing), queriers (searching), and query frontends (parallelization). Each component scales independently, allowing precise resource allocation for specific workload patterns.
Seamless Grafana Integration: Native integration with Grafana provides unified dashboards combining logs with Prometheus metrics. LogQL query language mirrors PromQL syntax, reducing learning curves for teams familiar with Prometheus monitoring.
Horizontal Scalability: Stateless components and object storage integration enable linear scaling to millions of events per second. Adding distributor pods increases ingestion capacity independently from query performance.
Real-World Performance: Organizations process 40,000+ log records per second across 30TB monthly using Loki's efficient architecture. The label-based approach provides millisecond response times for filtered queries while maintaining cost-effective long-term retention.
Limitations: Loki's efficiency comes at the cost of reduced full-text search capabilities. Complex text-based queries across all logs can be slower than Elasticsearch, making it less suitable for security incident response requiring arbitrary text searches.
Optimal Use Cases: Loki excels in Kubernetes environments with well-structured applications that generate consistent log formats. Teams prioritizing cost optimization over complex search capabilities find Loki's trade-offs highly favorable.
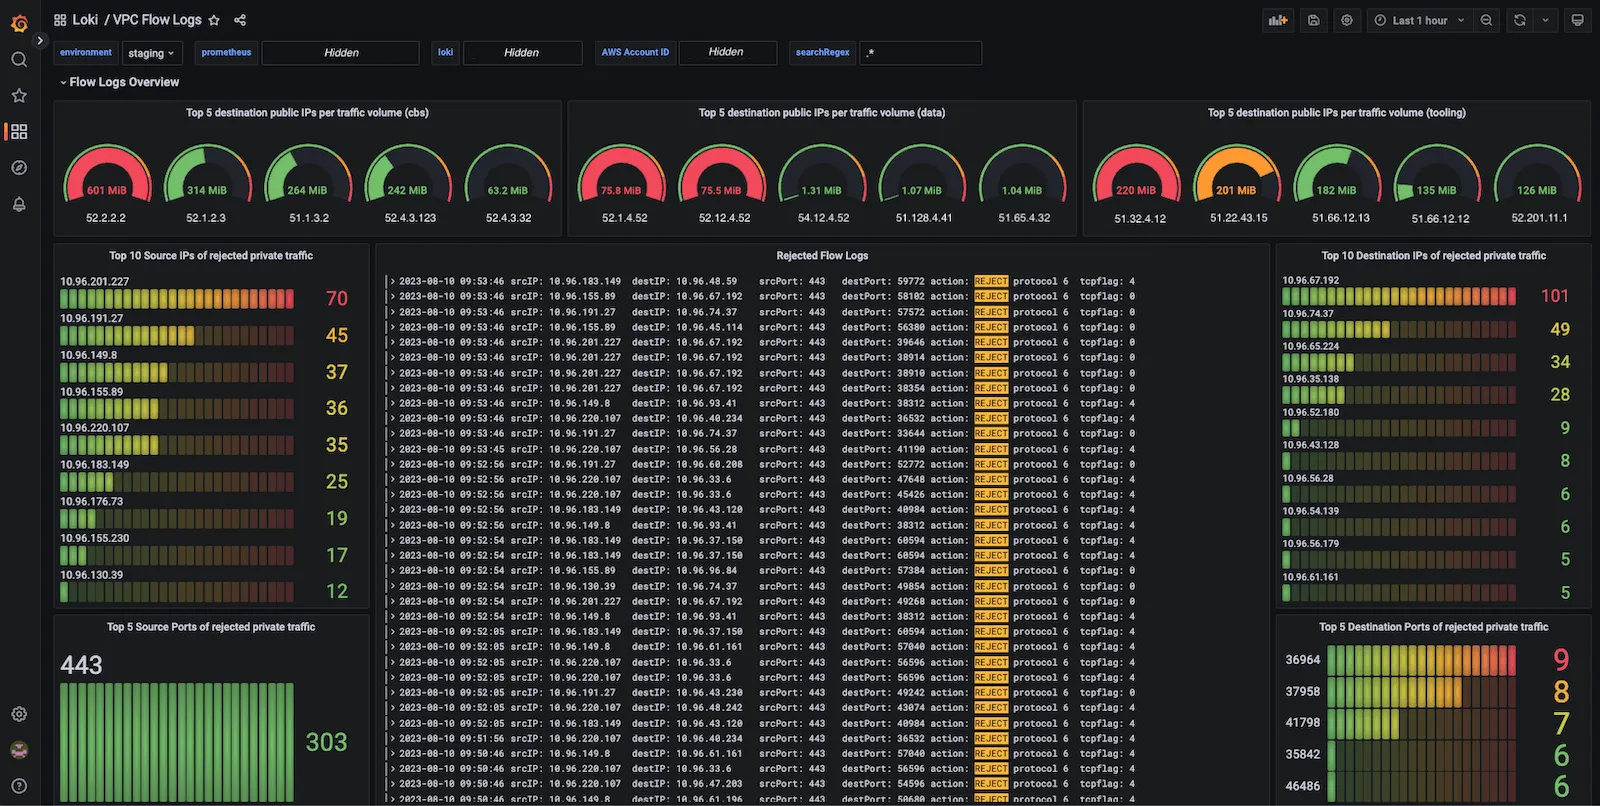
3. Graylog - Enterprise-Ready Log Management Platform
Graylog provides a complete log management solution combining collection, processing, storage, and analysis in a unified platform. Designed for enterprise environments, Graylog offers sophisticated features often found only in commercial solutions.
Comprehensive Platform Integration: Unlike tools requiring separate components, Graylog provides end-to-end log management through a single interface. This integration reduces operational complexity and provides consistent user experiences across different logging tasks.
Advanced Processing Capabilities: Graylog's streams and processing pipelines enable real-time log categorization and enrichment. Complex routing rules direct different log types to appropriate storage or alerting channels without external processing tools.
Enterprise Security Features: Built-in user authentication, role-based access control, and audit logging support compliance requirements. The platform includes content packs with pre-configured parsers for common enterprise applications.
Flexible Storage Backend: Graylog uses Elasticsearch or OpenSearch for storage while abstracting complexity through its management interface. This approach provides powerful search capabilities without requiring deep Elasticsearch expertise.
Consumption-Based Pricing: Graylog's 2025 pricing model charges based on "Active Data" rather than just ingestion volume, providing more predictable costs for organizations with varying retention requirements.
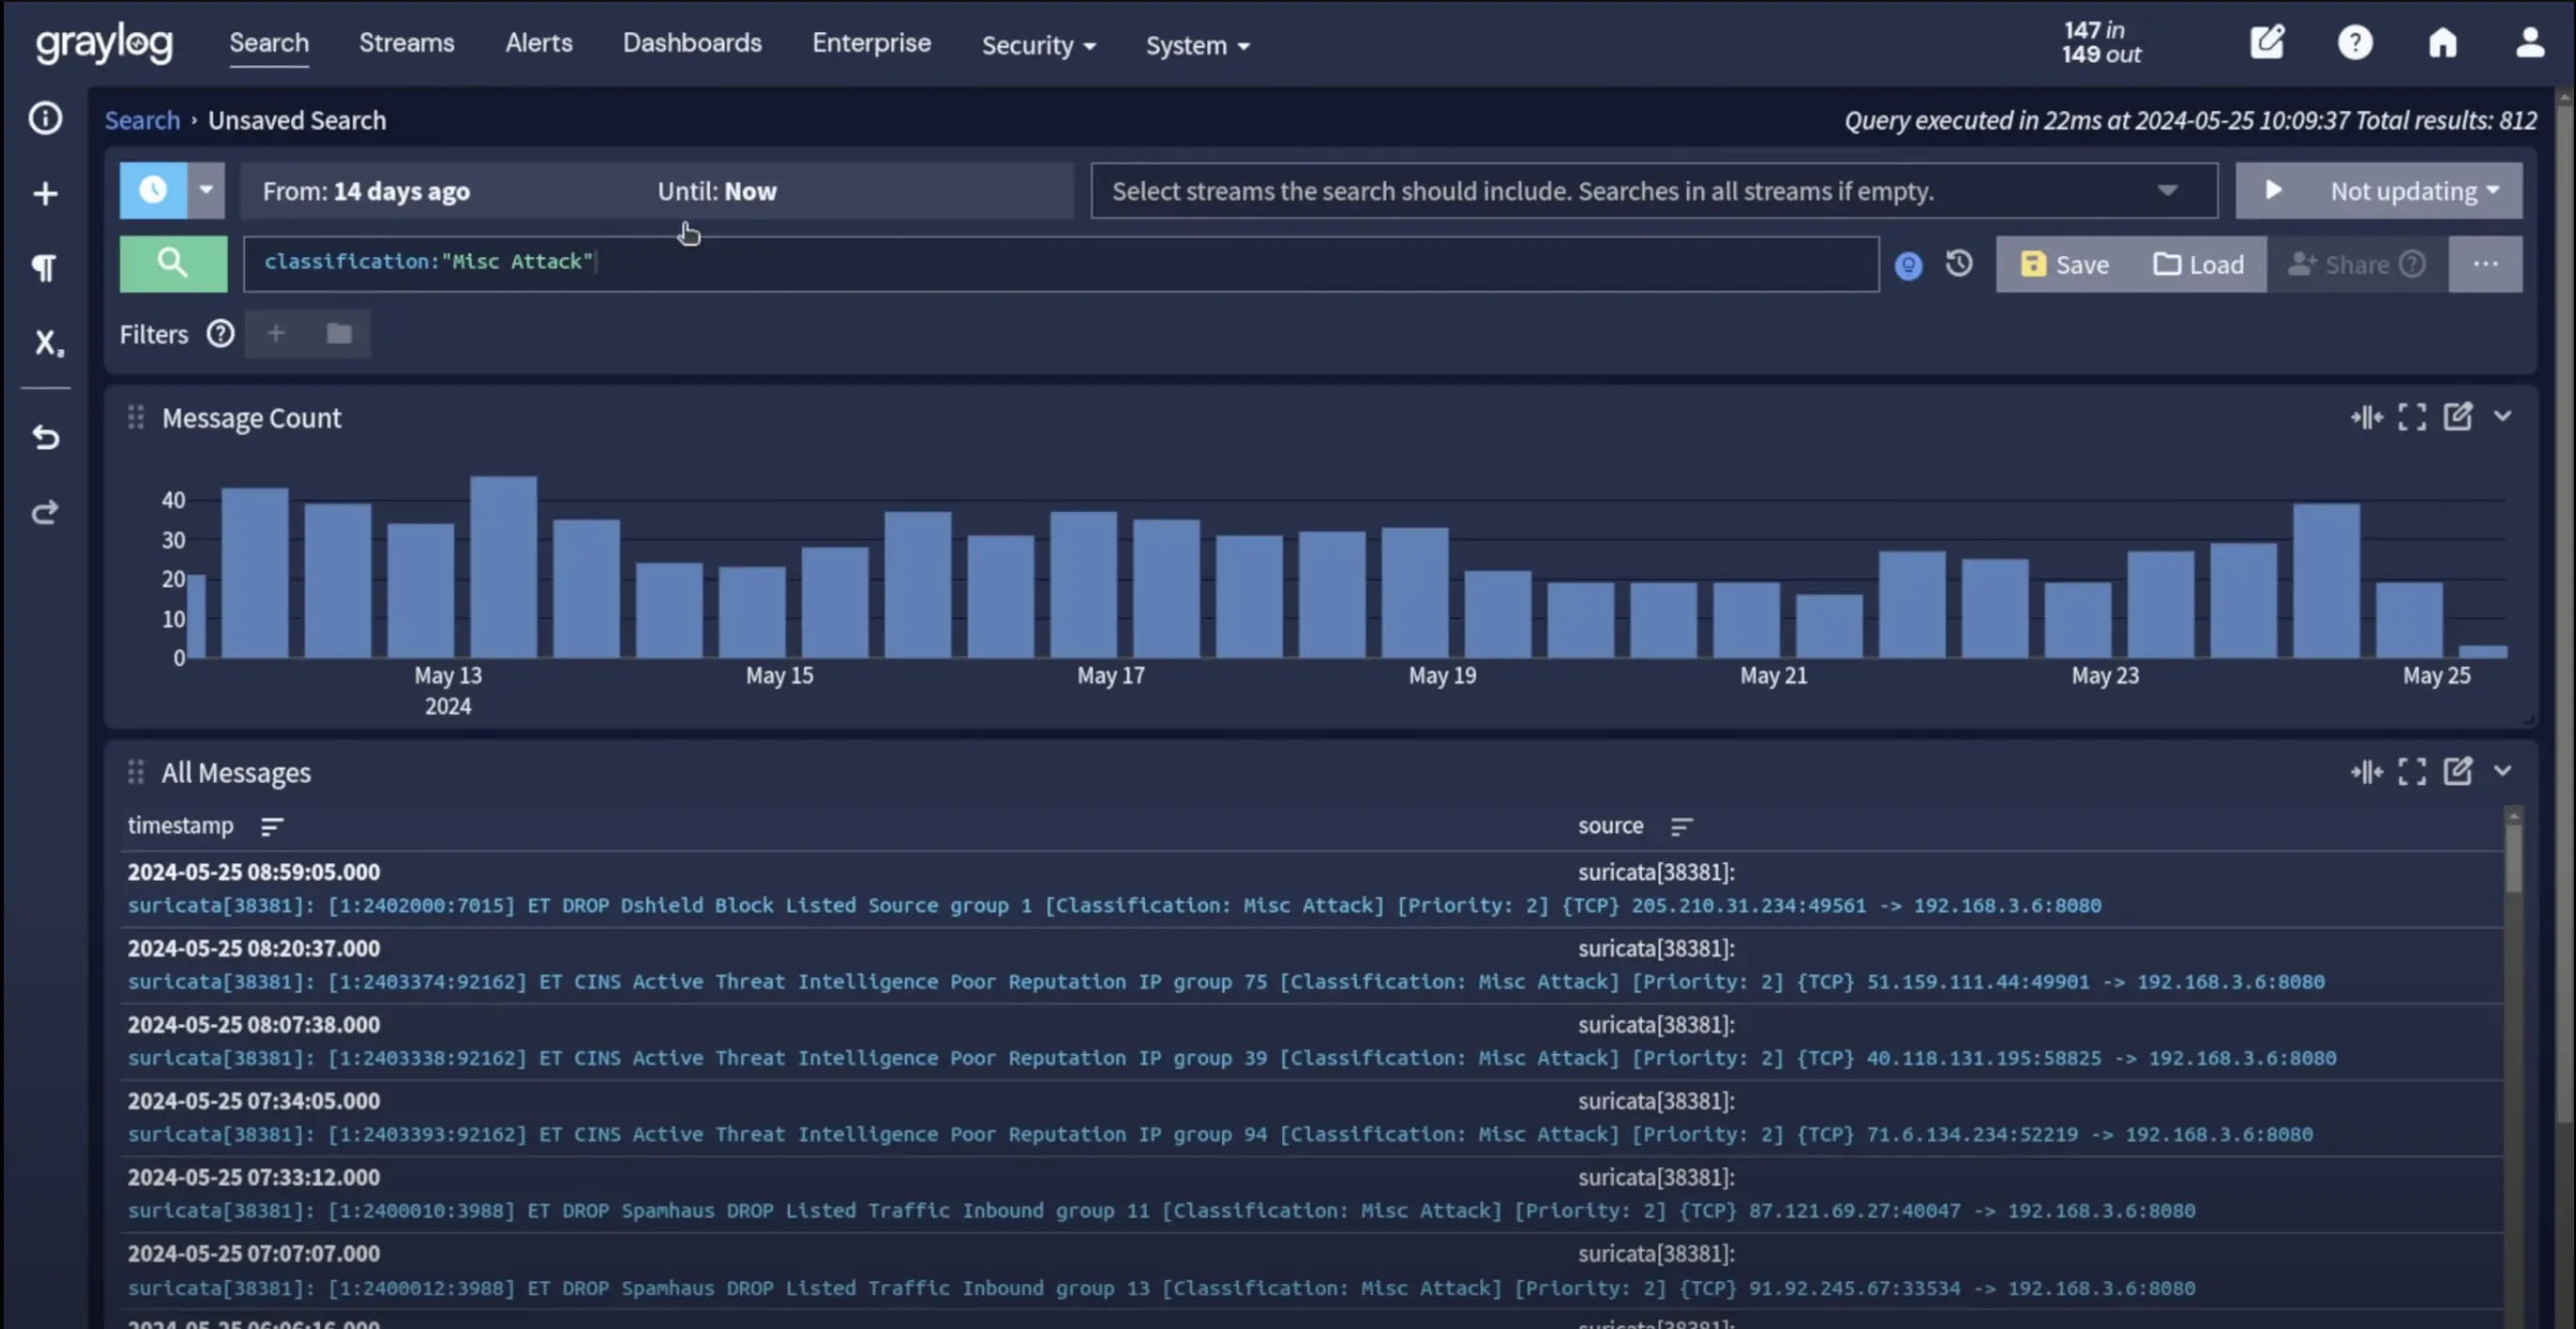
Alerting and Notifications: Sophisticated alerting based on search queries, statistical analysis, or correlation rules. Multiple notification channels including email, Slack, PagerDuty, and webhooks ensure rapid incident response.
Recent Enhancements: The 2025 release introduced Adversary Campaign Intelligence for threat detection, Data Lake Preview for enhanced data management, and Selective Data Restore capabilities.
Architecture Considerations: Graylog requires MongoDB for metadata and configuration storage alongside Elasticsearch/OpenSearch for log data. This multi-component architecture provides flexibility but increases operational overhead compared to single-binary solutions.
Deployment Complexity: While Graylog simplifies many log management tasks, initial setup and scaling require understanding of multiple backend systems. Organizations need expertise in MongoDB and Elasticsearch operations for production deployments.
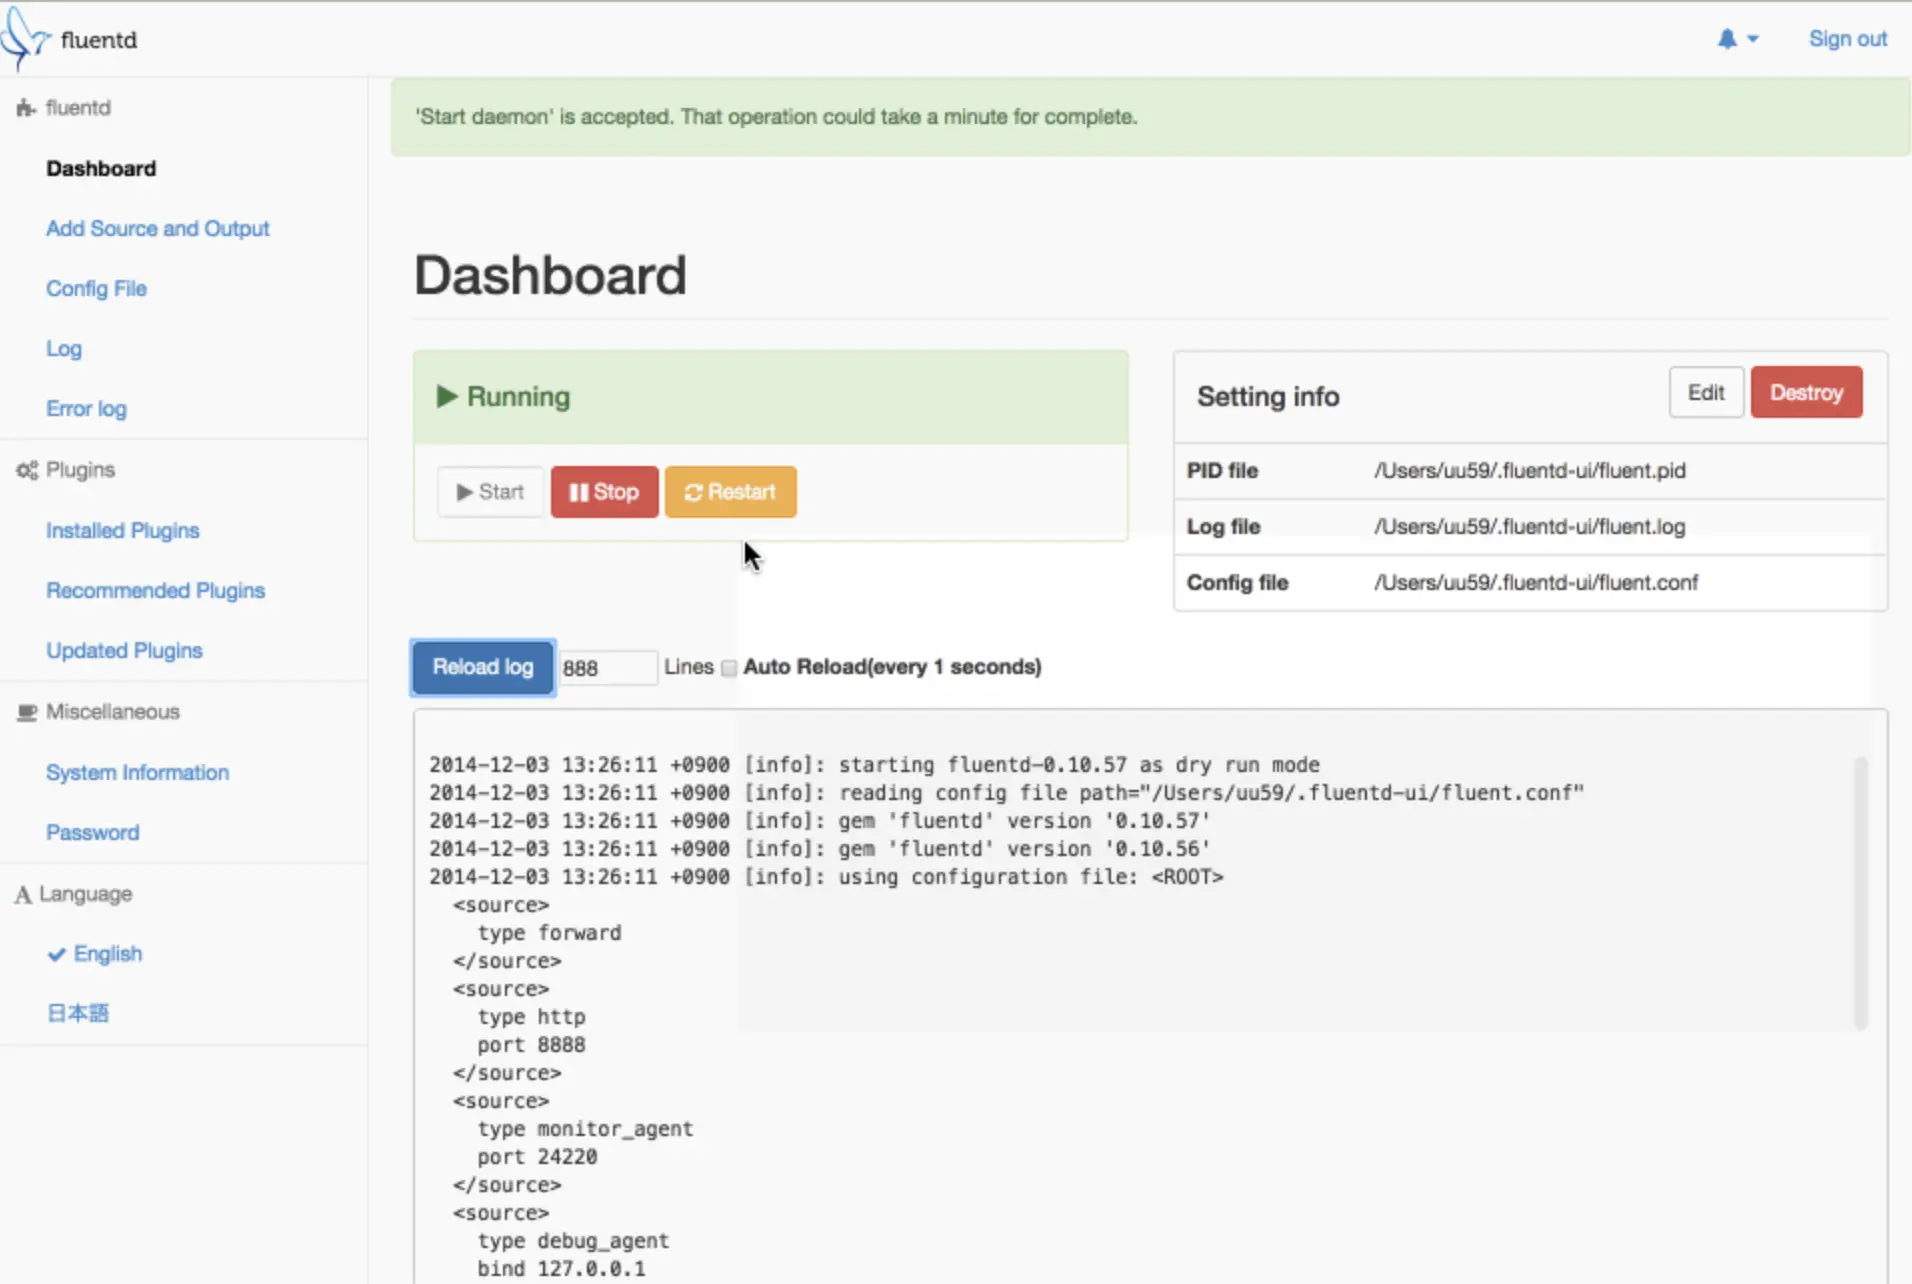
4. FluentD and Fluent Bit - Universal Log Collection
The Fluent ecosystem provides the industry standard for log collection and routing. FluentD serves high-volume aggregation scenarios, while Fluent Bit handles resource-constrained environments like edge devices and containers.
Unified Logging Layer: FluentD abstracts log collection complexity through a plugin-based architecture supporting over 600 integrations. This approach decouples log producers from storage backends, enabling flexible data routing without application changes.
Exceptional Plugin Ecosystem: Extensive plugins support virtually every log source and destination. Input plugins handle files, syslog, HTTP, message queues, while output plugins send data to Elasticsearch, Kafka, cloud services, databases, and analytics platforms.
Resource Efficiency: Fluent Bit operates with minimal 4MB binary footprint and sub-100MB memory usage, making it ideal for sidecar containers and IoT devices. FluentD provides richer processing capabilities with moderate 40MB memory requirements.
Kubernetes Integration: Both tools deploy seamlessly as DaemonSets with automatic pod metadata enrichment. The kubernetes_metadata_filter plugin adds service names, namespaces, and container information to log records.
High-Performance Processing: FluentD processes up to 150,000 events per second per core using efficient buffering and asynchronous I/O. Fluent Bit achieves even higher throughput with its C-based architecture optimized for minimal resource consumption.
Scalability Patterns: FluentD scales through hierarchical fan-out architectures. Edge collectors on application nodes forward logs to regional aggregators, which apply complex processing before routing to storage systems. This pattern efficiently handles thousands of log sources.
Reliability Features: File-based buffering ensures at-least-once delivery guarantees. Persistent queues survive process restarts, while retry logic handles destination outages without losing data.
Production Adoption: Cloud providers including AWS and Azure use FluentD as the default log collector in managed Kubernetes services. Thousands of organizations rely on its proven reliability for mission-critical log collection.
Considerations: FluentD and Fluent Bit focus exclusively on collection and routing—they don't provide storage or analysis capabilities. Successful deployments pair them with analytics backends like Elasticsearch, Loki, or SigNoz.
5. Vector - High Performance Rust-Based Log Processing
Vector represents next-generation log processing, built in Rust for exceptional performance and reliability. Developed by Datadog and now open source, Vector addresses performance limitations of traditional log collectors.
Performance Revolution: Vector leverages Rust's memory safety and zero-cost abstractions to achieve 10x higher throughput than Java-based alternatives. SIMD acceleration and efficient memory management enable processing hundreds of thousands of events per second on modest hardware.
Exceptional Resource Efficiency: Vector operates with 450KB memory footprint while maintaining high throughput. This efficiency enables deployment in resource-constrained edge environments and reduces infrastructure costs in large-scale deployments.
Advanced Topology Support: Vector supports complex log processing topologies including fan-in/fan-out, filtering, routing, and transformation. These capabilities often eliminate the need for separate stream processing systems.
Observability-First Design: Built-in metrics expose detailed performance information about log processing pipelines. Integration with Prometheus provides comprehensive monitoring of collection infrastructure health.
Comprehensive Integration: Vector supports over 100 sources and sinks, including cloud-native protocols like OpenTelemetry and traditional formats like syslog. WebAssembly plugin system enables custom transformations without rebuilding the binary.
Kubernetes Optimization: Vector integrates deeply with Kubernetes through custom operators, RBAC configurations, and automatic service discovery. Dynamic configuration reloading enables zero-downtime updates to log processing rules.
Reliability Guarantees: Vector provides configurable delivery guarantees from at-least-once to exactly-once processing. Disk-based buffering and acknowledgment tracking prevent data loss during destination outages or network partitions.
Growing Ecosystem: While newer than FluentD, Vector has gained significant adoption in cloud-native environments. Major organizations report successful production deployments handling petabytes of log data monthly.
Considerations: Vector's advanced capabilities come with increased complexity compared to simpler collectors. Teams need to invest in learning VectorLang (VL) configuration syntax and understanding the processing topology concepts.
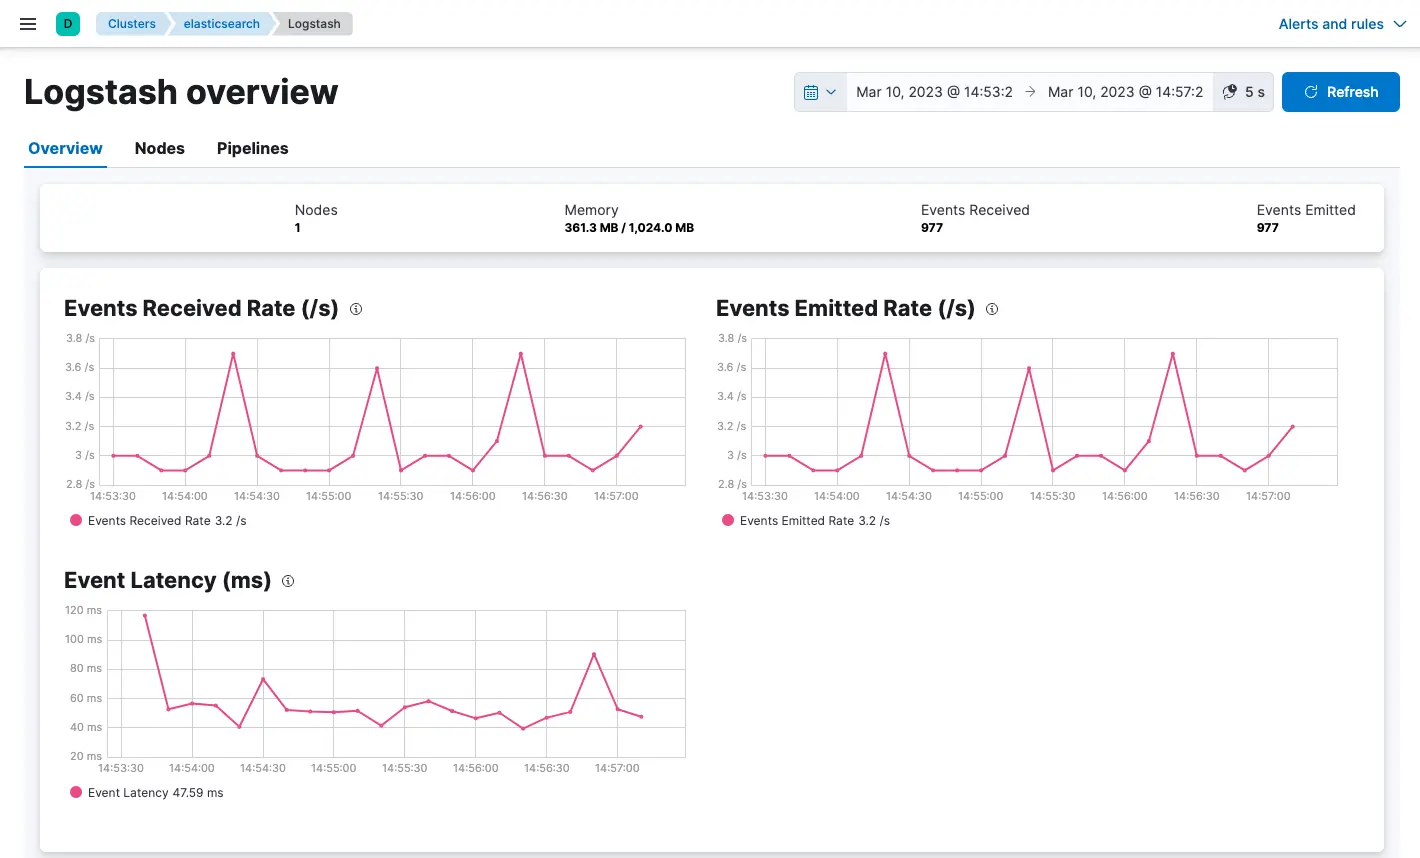
6. Logstash - Mature Log Processing Engine
Logstash remains a cornerstone of log processing, particularly within the Elastic ecosystem. Despite newer alternatives, Logstash offers powerful transformation capabilities and extensive integration options.
Rich Processing Pipeline: Logstash excels at complex log transformations using Grok patterns for parsing unstructured text. Regular expressions, conditional logic, and data enrichment plugins handle sophisticated processing requirements.
Extensive Plugin Library: Hundreds of plugins support diverse input sources, processing filters, and output destinations. This ecosystem maturity provides solutions for virtually any log processing requirement.
Powerful Transformation Engine: Grok patterns transform unstructured log text into structured fields. Mutate filters modify field values, while ruby filters enable custom processing logic for complex scenarios.
Persistent Queues: Disk-based persistent queues ensure log delivery even during Elasticsearch outages. This reliability makes Logstash suitable for mission-critical log processing where data loss is unacceptable.
Proven Enterprise Integration: Deep integration with Elasticsearch, Kibana, and Beats provides comprehensive log management within the Elastic ecosystem. X-Pack plugins add enterprise security and machine learning capabilities.
Limitations:
Resource Intensity: Logstash's JVM-based architecture consumes significantly more memory and CPU compared to modern alternatives. Typical deployments require 1GB+ RAM and multiple CPU cores per instance.
Scaling Challenges: Vertical scaling reaches practical limits, while horizontal scaling requires complex load balancing configurations. JVM garbage collection can cause processing delays during high-load periods.
Configuration Complexity: Logstash pipeline configuration requires understanding of multiple syntaxes and debugging skills. Complex transformations become difficult to maintain as processing requirements evolve.
Licensing Considerations: While Logstash remains open source under Apache 2.0 license, integration with commercial Elastic Stack components may require commercial licensing for some enterprise features.
Modern Alternatives: Many organizations have migrated from Logstash to Vector or Fluent Bit for improved performance and reduced resource consumption, while maintaining similar processing capabilities.
7. OpenSearch - Open Source Search and Analytics
OpenSearch emerged as the open source alternative to Elasticsearch following Elastic's licensing changes. It provides powerful full-text search and analytics capabilities for log data without commercial licensing restrictions.
Community-Driven Development: The OpenSearch project, backed by AWS and other major contributors, maintains full compatibility with Elasticsearch APIs while adding new capabilities. This approach ensures migration compatibility for existing Elasticsearch deployments.
Full-Text Search Excellence: OpenSearch excels at complex text searches across large datasets. Inverted indexes enable sub-second query responses even on petabyte-scale deployments with proper shard management.
Advanced Analytics: Aggregation queries provide sophisticated log analysis including histograms, percentiles, and geospatial analysis. Machine learning plugins detect anomalies and forecast trends in log data.
Scalable Architecture: Horizontal scaling distributes data across cluster nodes with automatic shard rebalancing. Dedicated master nodes manage cluster state while data nodes handle storage and query processing.
OpenSearch Dashboards: The integrated visualization platform provides rich dashboard creation, alerting, and data exploration capabilities. Custom visualizations and plugins extend functionality for specific use cases.
Enterprise Security: Fine-grained access control, field-level security, and audit logging support compliance requirements. Integration with LDAP, SAML, and OpenID Connect enables enterprise authentication.
Considerations:
Operational Complexity: OpenSearch requires significant expertise for optimal configuration, capacity planning, and troubleshooting. Index optimization, shard sizing, and cluster tuning demand specialized knowledge.
Resource Requirements: Production deployments typically require substantial hardware resources. Large clusters may consume hundreds of GB of RAM and require high-performance storage for acceptable query performance.
Data Storage Costs: Unlike newer solutions using object storage, OpenSearch requires expensive block storage for acceptable performance. Long-term retention costs can become prohibitive for high-volume deployments.
No Built-in Collection: OpenSearch provides only storage and analysis—it requires separate tools like FluentD, Vector, or Logstash for log collection and processing.
8. Syslog-ng - Enterprise Log Forwarding
Syslog-ng serves as a high-performance, enterprise-grade log collection and forwarding solution, particularly strong in network device logging and traditional enterprise environments.
High-Performance Architecture: Syslog-ng processes 600,000-800,000 messages per second on single nodes through efficient C-based implementation and optimized I/O handling. This performance makes it suitable for high-volume centralized logging scenarios.
Exceptional Reliability: Multi-hop delivery guarantees and disk-based buffering ensure logs reach destinations even during network outages. TLS encryption and message signing provide security for sensitive log data transmission.
Flexible Message Processing: Sophisticated filtering, parsing, and transformation capabilities handle diverse log formats. Regular expressions, conditional routing, and template-based reformatting address complex log processing requirements.
Enterprise Integration: Native support for legacy systems, network devices, and enterprise applications. Database outputs enable direct log storage in relational databases for compliance and reporting requirements.
Security Features: Built-in encryption, authentication, and access control protect log data during transmission and processing. Integration with enterprise key management systems ensures cryptographic key security.
Current Status: Syslog-ng version 8.0 entered full support in 2025, while the Long Term Support (LTS) path has deprecated most platforms except Windows Agent and AIX. Users should plan migrations to current versions for full platform support.
Deployment Patterns: Syslog-ng typically serves as the first hop in log collection pipelines, receiving logs from network devices, system logs, and applications before forwarding to analytics platforms like OpenSearch or SigNoz.
Comparison with Rsyslog: Both syslog-ng and rsyslog serve similar roles as enhanced syslog implementations. Rsyslog, the default on many Linux distributions, emphasizes raw performance with up to one million messages per second processing. Choice often depends on existing expertise and specific feature requirements.
9. rsyslog - High-Performance System Logging
Rsyslog is the default log processing system on most Linux distributions, providing high-performance log handling for system and application logs. Its widespread deployment makes it a critical component in many log management architectures.
Performance Leadership: Rsyslog processes up to one million messages per second through highly optimized C code and efficient queuing mechanisms. This performance advantage makes it ideal for high-volume system logging requirements.
Universal Deployment: Pre-installed on most Linux systems, rsyslog requires minimal configuration for basic log collection. This ubiquity ensures consistent log handling across diverse server environments without additional software installation.
Modular Architecture: Plugin-based design enables functionality extension without core system changes. Input, output, and processing modules provide flexibility while maintaining high performance.
Advanced Queuing: Multiple queue types including disk-assisted queues handle varying throughput requirements. Memory queues provide maximum performance, while disk queues ensure reliability during high-load periods.
Template System: Flexible message formatting enables customized log output formats. Templates support complex transformations including JSON formatting, field extraction, and conditional formatting.
Network Security: TLS encryption, authentication, and rate limiting protect against log injection attacks and unauthorized access. Integration with system authentication provides centralized access control.
Configuration Complexity: Advanced rsyslog configurations can become complex, requiring understanding of multiple syntax formats and processing rules. Documentation quality varies, with some advanced features poorly documented compared to alternatives.
Modern Extensions: Recent versions add JSON processing, Elasticsearch output, and containerized deployment support. However, many advanced features require careful configuration tuning for optimal performance.
Enterprise Adoption: Large enterprises rely on rsyslog for centralized system log collection from thousands of servers. Its reliability and performance make it suitable for mission-critical logging infrastructure.
10. Logwatch - Automated Log Analysis and Reporting
Logwatch provides simple automated log analysis and reporting for Linux systems. Unlike real-time log management platforms, Logwatch performs periodic analysis and generates digestible summary reports.
Simplicity-First Approach: Logwatch works out-of-the-box on most Linux systems without complex configuration. This zero-configuration approach makes it valuable for smaller environments or as a complement to comprehensive log management systems.
Automated Security Monitoring: Pre-built parsers identify security-relevant events including failed login attempts, sudo usage, firewall blocks, and unusual system activities. Daily reports provide security teams with actionable summaries.
Low Resource Impact: Periodic execution model consumes minimal system resources compared to continuous log monitoring solutions. This efficiency makes Logwatch suitable for resource-constrained environments.
Email Integration: Automated email delivery ensures administrators receive log summaries without actively monitoring dashboards. Configurable report detail levels balance information completeness with readability.
Customizable Reporting: Service-specific reports cover SSH, web servers, mail systems, and system events. Custom filters enable focus on relevant events while reducing noise from routine activities.
Limitations:
No Real-Time Monitoring: Logwatch provides historical analysis rather than real-time alerting. Critical security events may not be noticed until the next scheduled report generation.
Limited Scalability: Designed for single-server environments, Logwatch doesn't provide centralized log collection or analysis across multiple systems.
Basic Processing Capabilities: Simple pattern matching and counting provide basic analysis compared to advanced correlation and anomaly detection available in modern platforms.
Optimal Use Cases: Logwatch excels in small-scale deployments where daily log summaries are sufficient, or as a supplementary tool providing automated security monitoring alongside comprehensive log management systems.
Architecture Patterns and Deployment Strategies
Modern log management architectures often combine multiple tools to balance performance, cost, and functionality requirements. Understanding these patterns helps optimize deployments for your organizational needs.
Hybrid Collection Architectures: Many organizations deploy lightweight collectors (Fluent Bit, Vector) on application nodes with centralized aggregators (FluentD, Logstash) handling complex processing. This two-tier approach optimizes resource usage while maintaining processing flexibility.
Storage Tier Optimization: Cloud-native solutions like Grafana Loki leverage object storage for cost efficiency, while traditional solutions require expensive block storage. Hybrid approaches use hot/warm/cold storage tiers to balance query performance with cost optimization.
Query Performance Patterns: Full-text indexing solutions (OpenSearch, Elasticsearch) provide superior performance for arbitrary text searches but consume significant resources. Label-based indexing (Loki) offers better cost efficiency for structured queries but slower full-text search capabilities.
Scalability Considerations: Microservices architectures (Loki, SigNoz) enable independent scaling of ingestion, storage, and query components. Monolithic solutions (Graylog, traditional ELK) require coordinated scaling of entire stacks.
Kubernetes-Native Deployments: Container orchestration enables sophisticated deployment patterns including automatic scaling, rolling updates, and resource optimization. Helm charts and operators simplify complex multi-component deployments.
Performance Benchmarks and Selection Criteria
Recent performance testing reveals significant differences between platforms across critical metrics:
Ingestion Performance: Vector and Fluent Bit lead throughput tests, processing 300,000+ events per second with minimal resource consumption. Traditional solutions like Logstash achieve only 20,000 events per second with substantially higher memory usage.
Query Latency: Label-based queries in Grafana Loki provide millisecond response times but full-text searches can take minutes. OpenSearch offers consistent sub-second performance for indexed fields but struggles with regex queries across large time ranges.
Storage Efficiency: Cloud-native solutions achieve 40% better compression ratios than traditional approaches while maintaining faster query performance. Object storage integration reduces long-term storage costs by 60-80% compared to block storage.
Resource Utilization: SigNoz and Loki demonstrate consistent low-resource operation under production loads. OpenSearch and traditional ELK stacks require significantly more RAM and CPU for comparable throughput levels.
Total Cost of Ownership: While open source tools eliminate licensing fees, operational costs vary dramatically. Simple solutions like Loki reduce engineering overhead, while complex platforms require specialized expertise for optimization and maintenance.
Selection Framework and Recommendations
Choosing the optimal log management solution depends on your specific requirements:
For Unified Observability: SigNoz provides integrated logs, metrics, and traces with OpenTelemetry compatibility. Ideal for teams wanting comprehensive observability without managing multiple tools.
For Cost-Sensitive Deployments: Grafana Loki offers exceptional cost efficiency through label-based indexing and object storage integration. Best suited for well-structured applications with predictable query patterns.
For Enterprise Complexity: Graylog delivers comprehensive platform capabilities including SIEM features, enterprise authentication, and regulatory compliance support.
For High-Performance Collection: Vector and Fluent Bit provide maximum throughput with minimal resource consumption. Ideal for edge deployments or high-volume collection scenarios.
For Existing Elastic Ecosystem: OpenSearch maintains compatibility while providing open source alternatives to commercial Elastic Stack components.
For Traditional Enterprise: Syslog-ng and rsyslog excel at reliable log forwarding from network devices, legacy systems, and high-volume system logging.
For Simple Deployments: Logwatch provides automated reporting for single-server environments without complex infrastructure requirements.
Conclusion
The open source log management landscape in 2025 offers mature solutions alongside innovative platforms addressing modern scalability and cost challenges. Traditional powerhouses like the ELK Stack continue serving complex enterprise requirements, while cloud-native solutions like Grafana Loki and SigNoz deliver exceptional efficiency for modern applications.
Success depends on matching platform capabilities with your specific organizational needs. Teams prioritizing simple integration and cost optimization should evaluate Loki's label-based approach or SigNoz's unified observability platform. Organizations requiring complex analytics or regulatory compliance may find traditional solutions like Graylog or OpenSearch better aligned with their requirements.
The trend toward OpenTelemetry standardization and object storage integration suggests future platforms will prioritize vendor neutrality and cost efficiency over proprietary features. Early adoption of these trends, particularly through platforms like SigNoz, positions organizations for sustainable log management at scale.
As log volumes continue exponential growth, solutions that minimize indexing overhead while leveraging cloud storage economics will increasingly dominate enterprise deployments. The architectural innovations pioneered by these open source platforms will likely influence the entire log management ecosystem as organizations seek alternatives to expensive commercial solutions.
Getting Started with SigNoz
SigNoz offers comprehensive log management capabilities including the advanced Logs Explorer with multiple view options, no-code query builder, and seamless correlation with metrics and traces. The platform's ClickHouse-backed storage delivers fast log ingestion and analysis, while OpenTelemetry Collector support ensures compatibility with your existing logging infrastructure.
You can choose between various deployment options in SigNoz. The easiest way to get started with SigNoz is SigNoz cloud. We offer a 30-day free trial account with access to all features.
Those who have data privacy concerns and can't send their data outside their infrastructure can sign up for either enterprise self-hosted or BYOC offering.
Those who have the expertise to manage SigNoz themselves or just want to start with a free self-hosted option can use our community edition.
Hope we answered all your questions regarding open source log management tools. If you have more questions, feel free to join and ask on our slack community.
You can also subscribe to our newsletter for insights from observability nerds at SigNoz — get open source, OpenTelemetry, and devtool-building stories straight to your inbox.
